
It is painful to watch how some enterprises treat the Scrum Master role like a commodity: Scrum Masters are all the same and easily exchangeable. A generic input and an expense to be reduced. They are often treated more as administrators and scribes than as critical enablers for delivering superior economic outcomes. As a result, the Scrum Master role is often viewed as a dead-end with no growth opportunity.
The Commodity Attitude and Agility
This commodity attitude is tragic for the individual laboring under this mindset and economically limiting for the enterprise. This mindset robs the enterprise of the Scrum Master’s and one of Agile’s fundamental value propositions: superior economic outcomes through our way of working.
The Agile Manifesto’s first declaration, “Individuals and interactions over processes and tools”, calls out the dramatic influence our ways of working together have on outcomes.
From study after study—from Scottish coal miners in the 1950s to NUMMI, the joint Toyota-GM venture in the 1980s, and even on nuclear submarines—we have learned that a key determinant to successful outcomes is how people work together.
This is Why I Am in This Crazy Agile Coaching/Mentoring Business
 Years ago, I believed that to deliver great products, you just assembled raw engineering talent and then got out of the way. My eyes would roll up whenever our leadership talked about methodology and practices.
I could not have been more wrong.
After quite a few hard lessons and some mentoring from the CEO of an amazing startup—Ken Spencer of Creo Products—I learned firsthand how people work together is an outsized driver of economic outcomes. Alistair Cockburn succinctly summed this up in his quip “People trump process.”
Agile as a Competitive Advantage
In most Agile frameworks, the Scrum Master role is primarily concerned with the team’s way of working. When we treat our Scrum Masters as commodities—interchangeable and as a cost to be reduced—we are demonstrating that we do not regard our way of working as a competitive advantage.
Unfortunately, commodity cultures struggle with sensing and responding to opportunities and threats in a volatile, uncertain, complex, and ambiguous (VUCA) world. Commodity cultures find it hard to exploit change for economic benefit.
So, if we believe our way of working is a competitive advantage, then how do we de-commodify the Scrum Master role and acknowledge the value this role brings?
Six Guidelines for De-Commodifying the Scrum Master
Here are six guidelines for de-commodifying the Scrum Master role and turning it into a contributor to Agile success:
1. Understanding What the Scrum Master’s Role IS NOT
First, let’s be perfectly clear, the Scrum Master is not an administrator putting meetings on people’s calendars. They are not a scribe taking notes from those meetings to present to a project manager. And most certainly, they are not a project manager assigning and dictating tasks to the team.
2. Understanding What the Scrum Master’s Role IS
Their job is helping the team be a team and not a group of people who happen to work together. Their job is to help them discover their greatness as a team. Yes, I know this sounds fuzzy, but after being in this industry for nearly 40 years, I have discovered one truth: the fuzzy stuff drives economic outcomes.
Orgs must acknowledge that the Scrum Master role is primarily a coaching role. In fact, I like to say their job is to put me (an Agile coach) out of a job. Coaching is an intimate relationship with a team and is very much influenced by personality types. An individual who is a rock star with one team could fall flat with another. A team should be able to interview their Scrum Master, even if it is a team member who is being considered for the role.
3. Position the Scrum Master Role as an Opportunity for Advancement
 Third, the Scrum master role must be seen as an opportunity to advance one’s career by developing strong facilitation and coaching skills. These are essential skills for anyone seeking a leadership role in an enterprise regardless of whether they see themselves as a manager or a senior engineer. Leaders must learn it’s not about making themselves appear great but about making others great.
The Scrum Master role is an excellent gateway to developing those skills. Contract Scrum Masters bring valuable new skills into the enterprise and can help start an organization on their Agile journey by mentoring and coaching internal Scrum Masters. However, to truly grow an agile organization, the Scrum Master role should be performed by someone who desires to grow their career with the enterprise.
4. Acknowledge That the Scrum Master is Not Always a Full-Time Role
Fourth, the Scrum Master role should not be a full-time job description.
A newly formed team may need full-time coaching to help them speed up their journey through the Tuckman curve (forming, storming, norming, and performing). However, as the team begins to function as a team, the direct coaching demands of the Scrum Master will diminish.
Personally, I prefer an appropriate team member who has leadership aspirations to receive 50% release time from their regular responsibilities to fulfill this role. Other enterprises may have a Scrum Master facilitate multiple teams.
5. Delegate the Running of the Team to the Scrum Master and Their Team
Fifth, delegate ownership of the team’s way of working to the Scrum Masters and their team.
Far too many enterprises are obsessed with “maturity,” which is often code for rigid compliance to some centrally defined framework or methodology. This compliance mindset impedes relentless improvement. Agile is about sensing and responding to change, and the way of working must also sense and respond to change. Practices introduced by Agile frameworks are a good starting point but were never intended to be a methodological straight jacket. After all, why do we have retrospectives if not to improve our way of working?
A discipline of “improvement experiments” can serve as an important guardrail on the evolution of the teams’ way of working. Most importantly, when the team owns their way of working, they will need time and space to focus collectively on improving their way of working. It’s not going to happen “after hours”.
6. Set Up a Support System for the Scrum Master
Finally, don’t let the Scrum Masters stand alone. Set up a supporting ecosystem for the Scrum Masters to share, learn, and improve together.
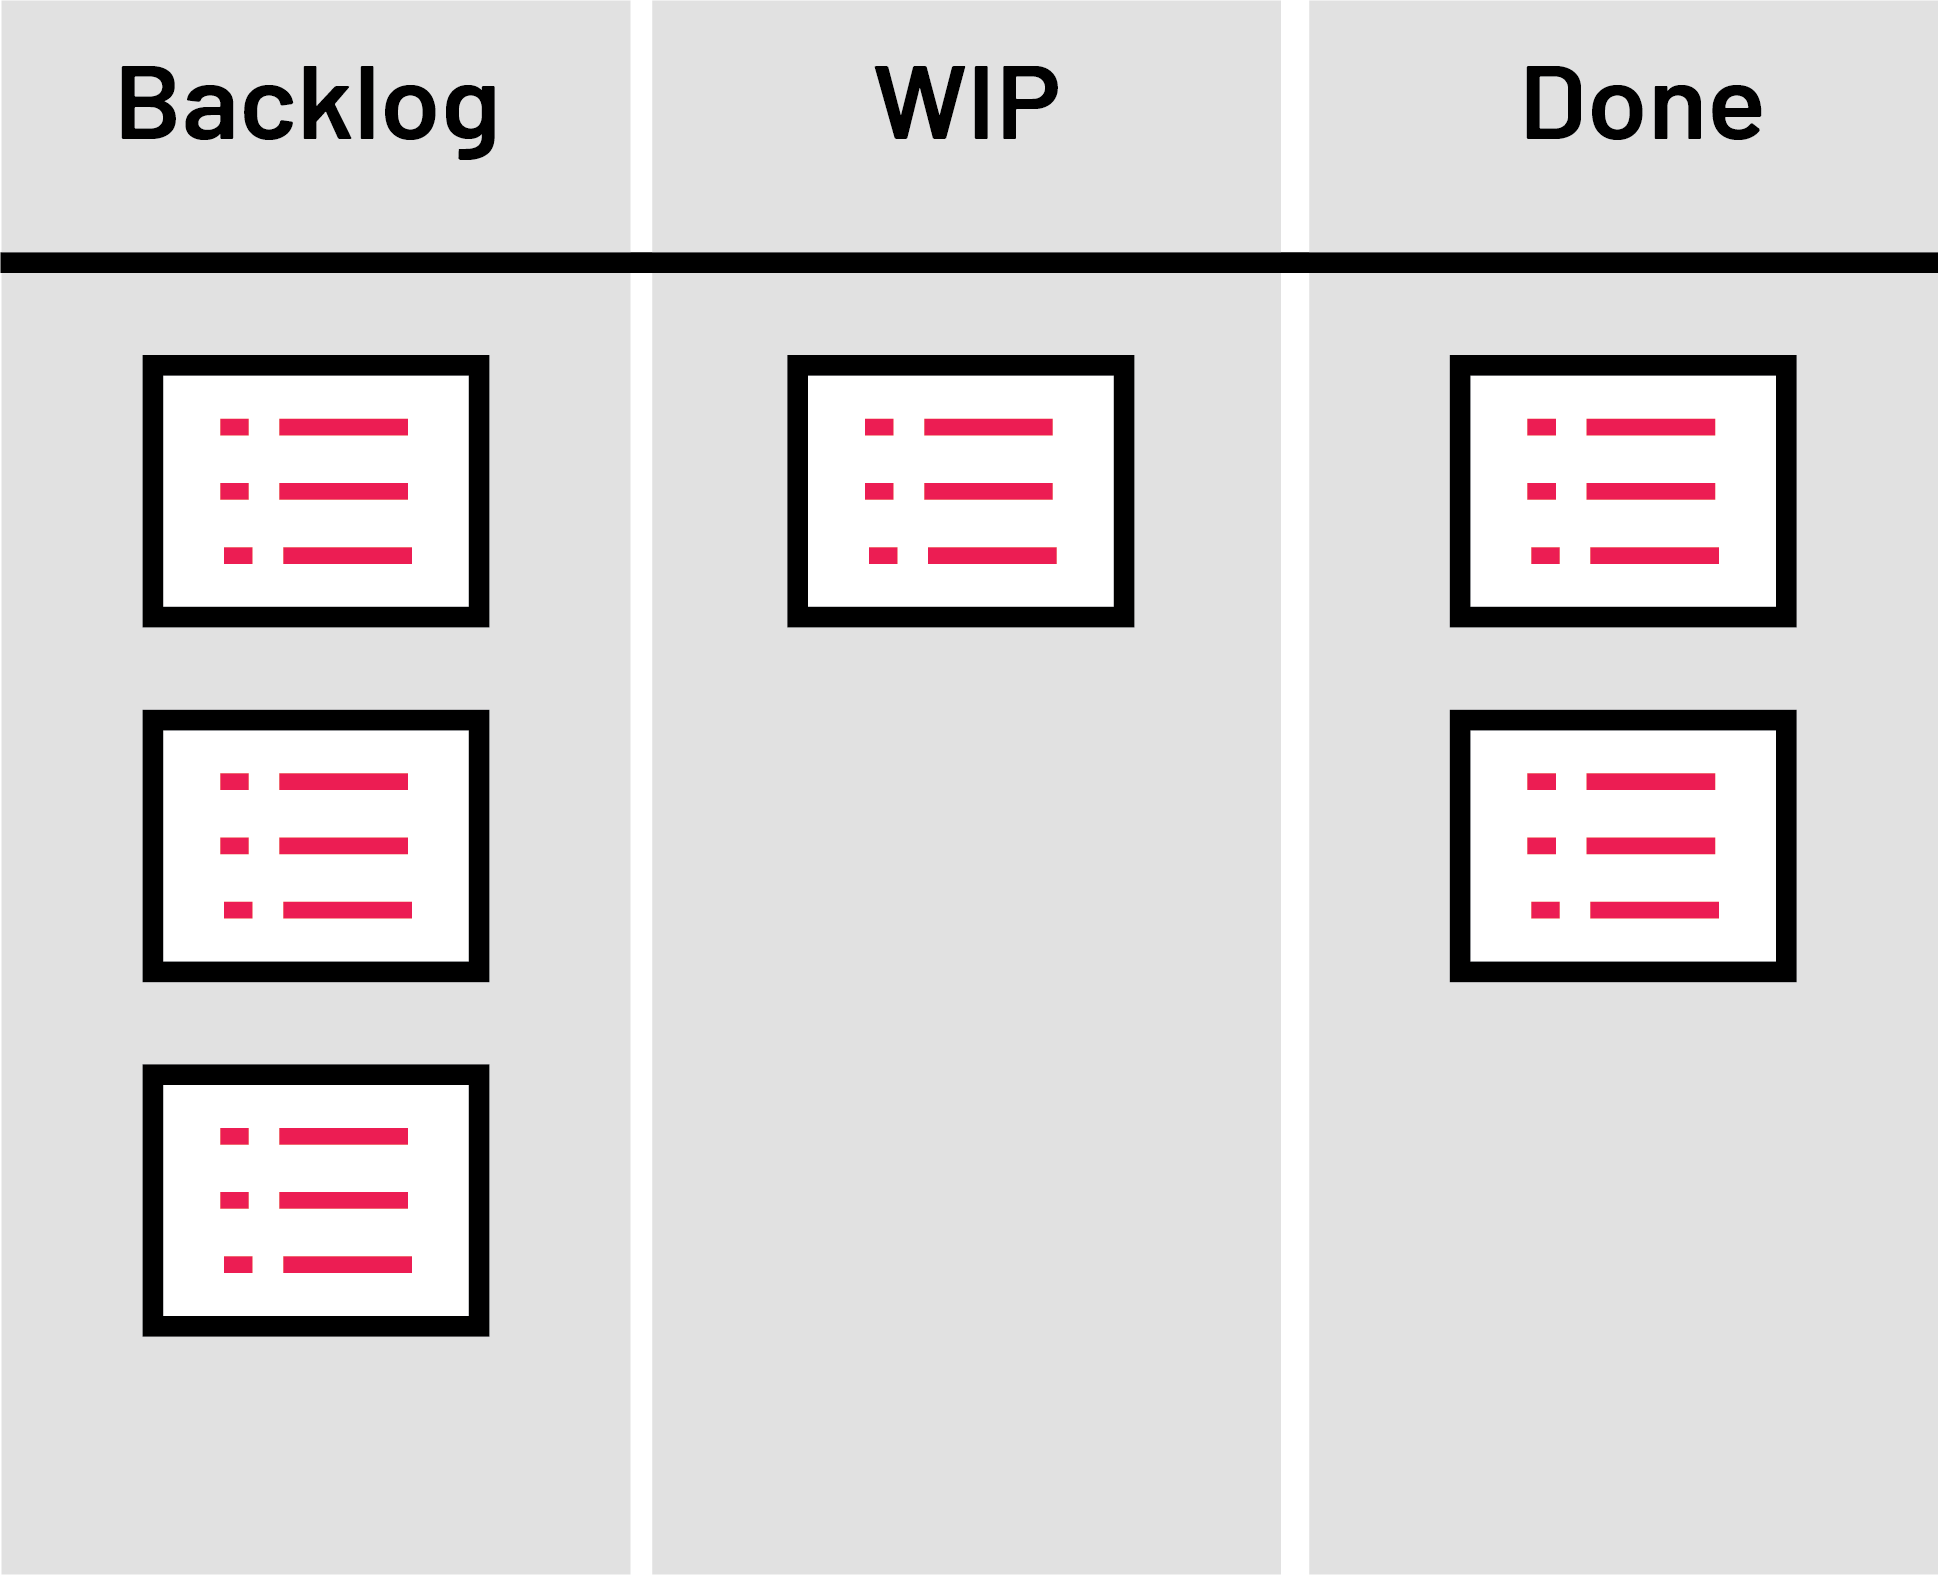
Do this by establishing a Scrum Master community of practices (CoP). The CoP becomes the focal point for mutual support and collectively driving improvement. During practice meetings, Scrum Masters can seek advice and share their experiences. A simple mantra we have for the Scrum Master CoP is, “we’ve got your back!” Through the CoP, Scrum Masters can drive improvement by sharing the results of improvement stories and deciding on improvement stories to add to their respective backlogs.
How an enterprise treats its Scrum Masters is a barometer of the value it places on its way of working.
- Are the Scrum Masters seen as valuable drivers and contributors to relentlessly improving outcomes, or are they seen as just another commodity and all the same and interchangeable?
- Do they foster team growth or is their job to perform administrative and reporting tasks for the team?
- Is their role to actively drive process improvement or to enforce compliance with fossilized standard operating procedures and practices?
How we answer these questions is the difference between “doing Agile” and being agile.
 The traditional
  Epic owners will pull the most promising epics into the analysis stage. During analysis, your team members must define the minimum viable product (MVP) threshold, create a Lean business case, obtain preliminary customer validation, and outline the scope of the epic. After analysis, the Portfolio Manager will make a final go/no-go decision.
 SAFe roles, practices, and artifacts come from proven patterns for realizing Agile and Lean principles. There is nothing sacred about the practices themselves. They are practices to help you begin with realizing business agility throughout the enterprise. They are not rules. If you want to adjust, you simply need data to inform your decisions.
 Companies gather enormous volumes of data from various sources. For data to be meaningful, it must be accessible for analysis. Yet fresh data enters the organization every second, in multiple formats, and is stored in various locations.
 Moving and managing the massive volume, variety, and velocity of big data requires advanced tools and techniques. Your big data integration system needs intelligent big data pipelines that can automatically move, consolidate, and transform big data from multiple data sources while maintaining lineage. It must have high scalability, performance, profiling, and data quality capabilities to handle real-time, continuously streaming data.
 Application integration through an API allows separate applications to work together by moving and syncing data between them. This can support operational needs, such as ensuring that your HR system has the same data as your finance system. Since various applications usually have unique APIs for giving and taking data, Software as a Service (SaaS) application automation tools like Workato can help you create and maintain native API integrations efficiently and at scale.
 When was the last time they thought about how to improve their processes and/or tools? Agile way of working is inherently iterative in nature, which means there should be natural checkpoints for the team to inspect their way of working and make adjustments as needed. The mindset of continuous improvement is not always easy for teams to adopt, but it will provide benefits once the team can establish a healthy routine of regularly reviewing how they work together.
 Atlassian Jira is a powerful project management tool used by thousands of organizations worldwide. With its user-friendly interface and robust features, Jira makes it easy to track and manage complex projects.
 JSM also offers multiple scalability options, including customizable workflows, powerful templates, and automation rules. These features make it easier for businesses to stay competitive, regardless of their size and scope.
 We’re thrilled to share that Cprime has received Atlassian Partner of the Year 2022: Agile at Scale Solutions. Read the official
  We’re thrilled to announce that Cprime has acquired
  GitLab offers a wide assortment of plugins and integrations, allowing you to extend and enhance its already impressive functionality. These integrations leverage the overall functionality of the ecosystem and improve the development workflow, making the development team’s work easier and faster.
 Jenkins is an open-source software development platform enriched with continuous integration (CI) and other DevOps automation capabilities. Organizations use Jenkins to build and deploy applications and integrate with GitLab or other DevOps tools.
 Snyk is an open source security platform for finding vulnerabilities in the source code of an application. It further provides the severity of vulnerabilities, classifying them as major, minor, or critical, so you can prioritize and take suitable action.
 ESM stands for Enterprise Service Management and is often defined as “the use of ITSM (IT Service Management) principles to support all business functions across the enterprise.” However, we disagree with the limitations inherent in that definition.
 An optimal ESM program includes some combination of the following five core elements:
 A successful ESM solution must incorporate reporting that is robust enough to monitor both current and historical requests. Ideally, the team will use this reporting to routinely inspect the ESM practice and support continual improvement.