Static Analysis With SonarQube
SonarQube is a platform for analyzing software for bugs, vulnerabilities, and code smells. In addition to performing a variety of static analysis checks on your source, it presents the results in the form of rich reports that make it easy for you to improve your application’s security and stability.
In our previous SonarQube post, we set up a server and pointed a Java build at it. Now, you’re going to use SonarQube reports to find issues and fix them.
Set Up a Java Project
In our previous post, we used SonarSource’s sample code. This time, you’re going to make changes and commit them. You’ll only need to commit to a local repo, but you may want to fork the repo on GitHub to save your changes, too.
plugins {
id "jacoco"
id "java"
id "application"
id "org.sonarqube" version "3.0"
}
description = 'Example of SonarQube Scanner for Gradle Usage'
version = '1.0'
sonarqube {
properties {property 'sonar.projectName', 'SonarQube Test Project'
}
}
Then, if you don’t want to specify them on the command line, you can add your server address and authentication to gradle.properties.
org.gradle.jvmargs=-XX:PermSize=512M -XX:MaxPermSize=512M
systemProp.sonar.login=5b2034e871ec685ce42a1399ba6b2080b2c2490d
systemProp.sonar.host.url=http://192.168.7.139:9000
Run Static Analysis
Now, run the sonarqube build target.
% ./gradlew sonarqube
BUILD SUCCESSFUL in 7s
3 actionable tasks: 3 executed
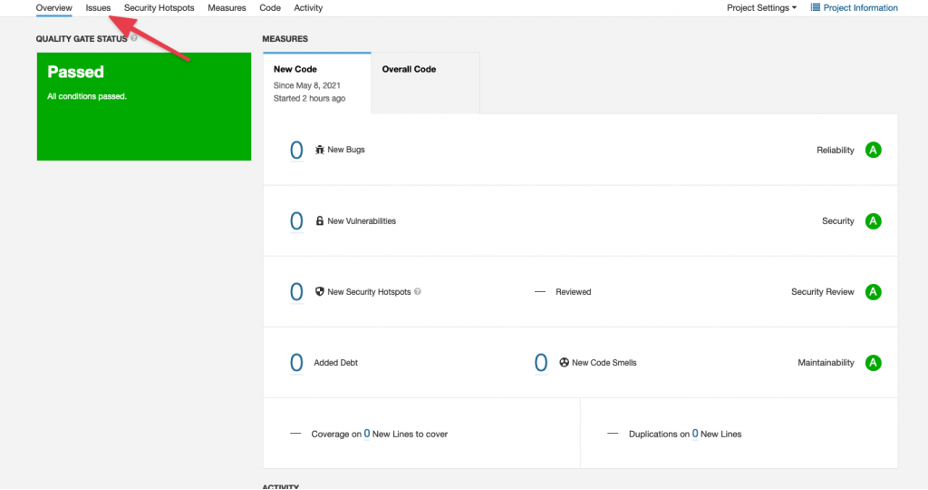
Your SonarQube dashboard has the analysis results.
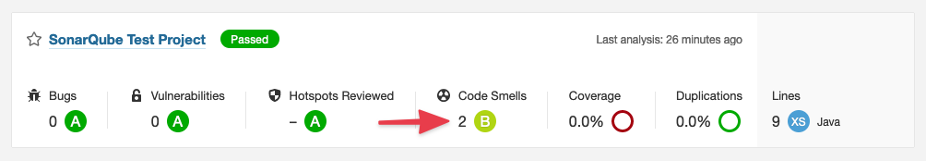
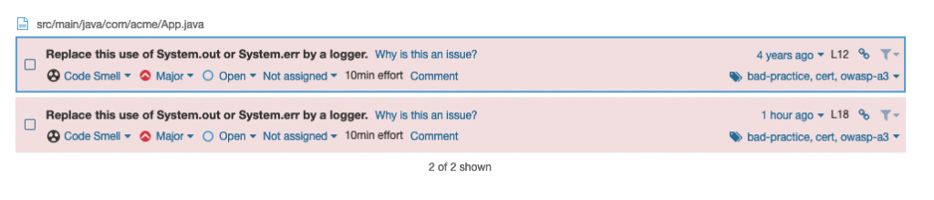
Sonarqube says it found two code smells. Drill down to learn more by clicking on the project title. Then, click the issues menu.
Now, you can see the actual issues.
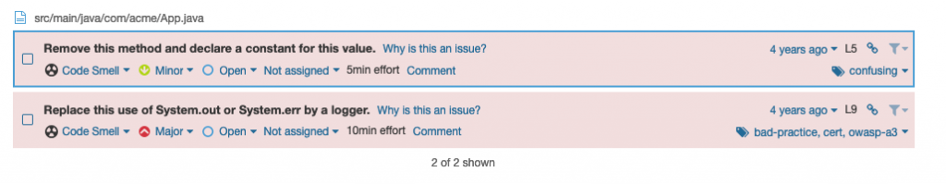
SonarQube gives you a description of the issue, along with information about the type and when it was added to the code. Since this display is from a forked repo, information about when SonarSource wrote the code is there.
Click on Why is this an issue? next to the first issue.
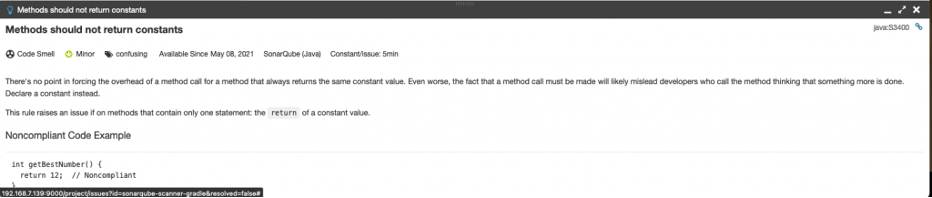
SonarQube displays details about the issue and how to address it.
Now, click on the issue.
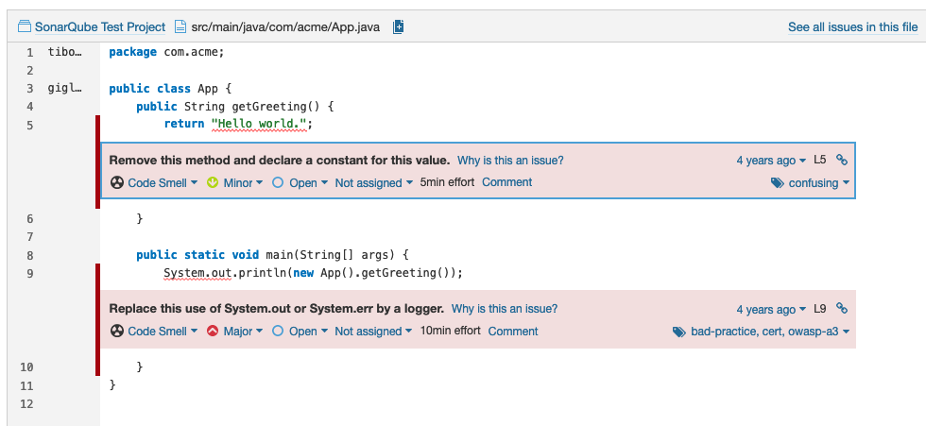
SonarQube shows you the source file, with the issues in-line.
Run a New Analysis
Let’s add a bug. Modify App.java so it looks like this:
package com.acme;
public class App {
private String greeting = "Hello world!";
public String getGreeting() {
return greeting;
}
public static void main(String[] args) {
System.out.println(new App().getGreeting());
}
public void setGreeting(String greeting) {
if (greeting == "Hello world!") {
System.out.println("That's the same greeting!");
}
this.greeting = greeting;
}
}
This change makes the greeting configurable. But, when a new greeting is set, it attempts to compare the value to the default with the == operator.
Commit this code first, then run a new analysis.
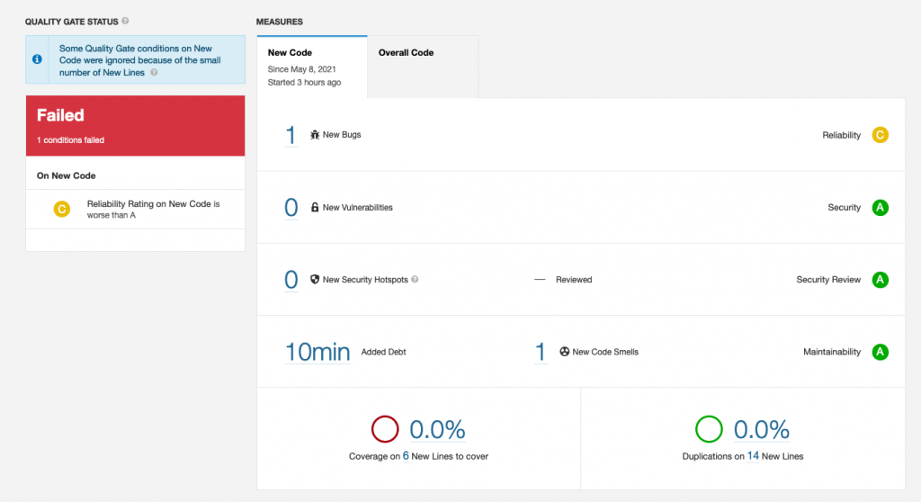
Comparing Strings with == is a bug. So, the analysis failed.
Before you look at the code, take a quick look at the overview. It says that you’ve added 10 minutes of technical debt with one new code smell. If you click on the 1, it takes you to the new System.out.println() in the new method you added. SonarQube helps you track technical debt as you work on your code.
The Overall Code tab gives you running totals of bugs, vulnerabilities, security issues, and code smells.
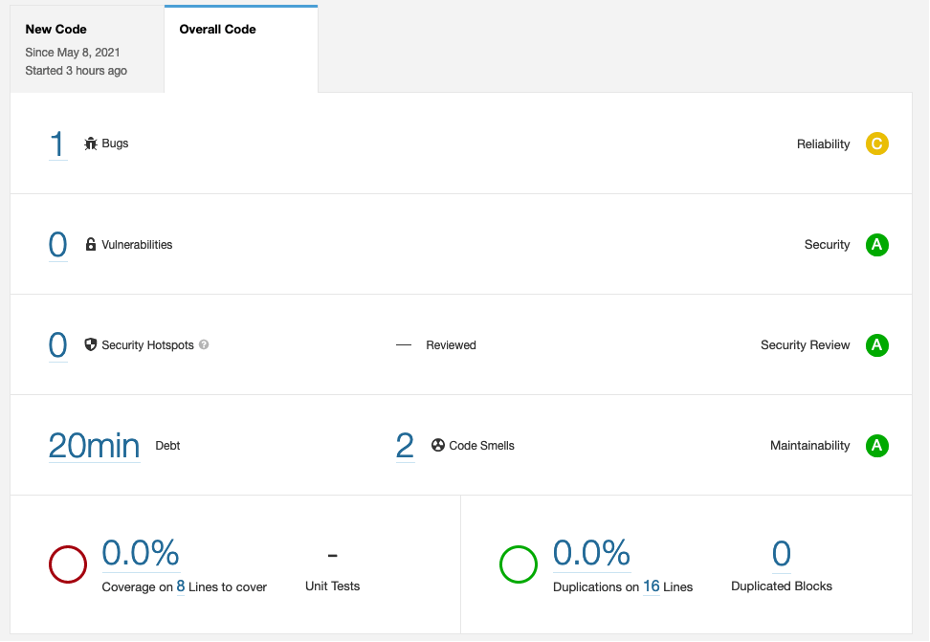
Since the code already had another instance of the same code smell, the total technical debt is 20 minutes.
Drill down to the code, and SonarQube shows the bug in-line.
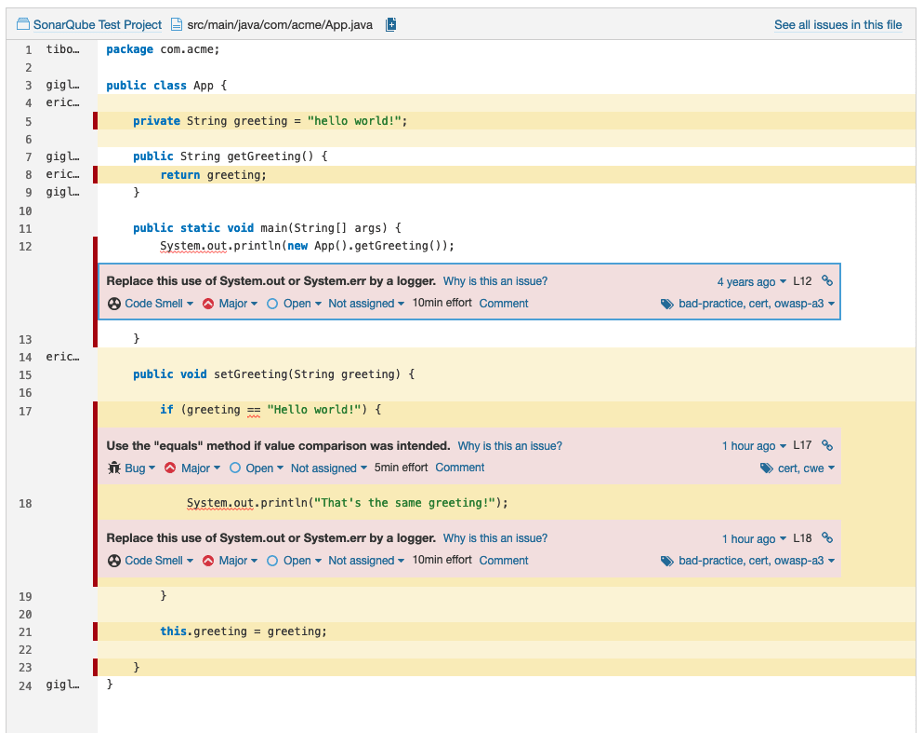
Since you committed the code change, accurate time information will be displayed, as well as git blame.
Click on one of the names on the left-hand side.
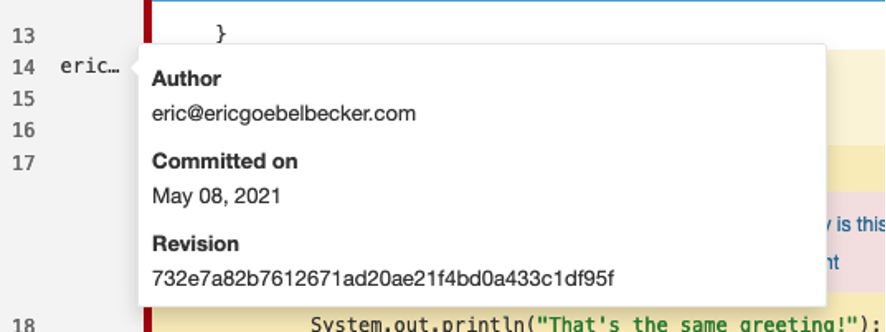
SonarQube saves detailed Git information with each report.
Fix the bug.
public void setGreeting(String greeting) {
if (greeting.equals("Hello world!")) {
System.out.println("That's the same greeting!");
}
this.greeting = greeting;
}
Finally, rerun the analysis.
The bug is gone, and the analysis has passed.
SonarQube Improves Your Code
In this post, you learned how to integrate a Java build into SonarQube. You saw sample code quality reports, as well as deficiencies displayed in-line with source code. Then, you modified the code to add and remove new bugs.
SonarQube makes it easy to add code analysis to your development workflow. In this post, you saw how easy it is to improve your application code.
SonarQube is a platform for analyzing software for bugs, vulnerabilities, and code smells. In addition to performing a variety of static analysis checks on your source, it presents the results in the form of rich reports that make it easy for you to improve your application’s security and stability.
In our previous SonarQube post, we set up a server and pointed a Java build at it. Now, you’re going to use SonarQube reports to find issues and fix them.