Atlassian Reporting: Agile Scrum Metrics that Matter
by Bryan McMillan, Agile Coach
Agile is a verb not a noun and far too many in IT have attempted to change it to a noun. To be agile is to able to move quickly and easily. Despite some of what has been written and even seem that the entire concept of metrics and measurements would be in direct contradiction to the Agile Manifesto, however, it is not. Comprehensive documentation, processes, and tools on the right side of Agile’s public declaration of policy are not in any way a formal indictment of reporting, metrics, or measures. In fact, it is quite the opposite. We absolutely must have metrics and measurements to help ensure we remain able to move quickly and easily to create working software. Reporting, metrics and measures are with us specifically to provide value. It can be illustrated best by a map and compass. We need both to ensure we are heading the correct direction toward the correct destination. For the purposes of this article let’s simplify reporting, metrics, and measurements downs to just metrics henceforth.
In my experience, a good number of folks do not really like or slightly care for metrics. This is due to a misunderstanding or misnomer that we are being watched for when they make mistakes. It is quite the contrary, as I mentioned before metrics are key to staying on track heading the right direction to obtain the correct results and to do such quickly and easily. Now some of the old timers, like myself, are all too aware that metrics have been with us time and memorial. That is to say metrics existed before Agile was ever thought of – in fact, before eXtreme Programming, before Spiral, before Incremental Block, and before any of the life cycles. And yes, even prior to the dreaded Waterfall lifecycle development by and for the US Department of Defense (DOD).
What exactly do metrics provide? What a great question, glad you asked! At a high-level we care about real-time data about how the work is going for starters. The progress on Epics, Stories, Spikes, Tasks and Bugs are not only important it is an imperative, as is the progress for the current Sprint or the current Release as a whole. Trending data is also important to know such as issues created verses resolve or Sprint Velocity over time. Good reporting leads us to better questions where we can make more informed decisions. This must be quick and easy to get, read, and understand. Metrics by their very definition must be relevant as near real-time (current) as possible and of course as close to the source where the data is generated as reasonably possible. These characteristics are the foundation of good reporting. Let us also not forget to ensure that each metrics must have a customer. No need to create any metric if their is not a customer or customers to consume the information.
Obviously, there are a multitude of items we can measure data wise with Atlassian’s Jira Software however, we only want to measure that which really matters. Please note that for all metrics shown in this article, Epics and Sub-Tasks are not part of the metric. And those things in Agile that matter at the Scrum Team level are:
- Health of the current Sprint
- Sprint Burndown chart
- Team’s Workload
- Who is carrying the Workload
- Blockers & Dependencies
- Issues that are assigned to me
Health of the Current Sprint
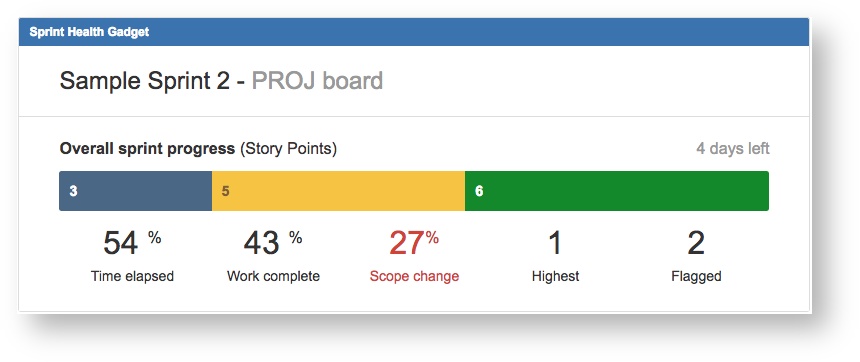
The Sprint Health Gadget provides a very quick and easy to use visual display of how are we doing in the current Sprint. In Jira, a standard Issue type is either an Epic, a Story, a Bug, or a Sub-task, where Sub-Task information rolls up to its parent. Our example shown here, illustrates extremely good information for the overall health of our Sprint.
Data Source: Jira Issues and Bugs
Measure Boundary: Current Sprint only
Measures: Number of Issues, Current Status, Time, Story Points (effort), Priority, and Flag
According to our example, we have only 4 days remaining in the Sprint, just over half of our two-week Sprint has elapsed, we have only 43% of the work completed, we have had a 27% scope change (i.e., additional Stories), there is one Issue that has the highest priority, and two Issues that have been flagged. Additionally, we see that 3 Story Points (i.e., Story or Bug) that are in “To Do” shown in the blue bar above the Time Elapsed, we have 5 Story Points that are currently in “In Progress” shown in yellow above Work Completed, and 6 Story Points that are done of the 14 total Story Points in this current Sprint.
HOW TO READ THIS METRIC: Obviously, based on this metric our Sprint is in dire straits in that we’ve not accomplished even one half of the work in the two weeks and we only have 4 days to produce another 57% of the work. It is very unlikely that this may occur and so we’ve overloaded the Scum Team considerably. Perhaps we lost one or two critical team members, perhaps we have 57% of the work in a “blocker” status, or perhaps we did not do a very good job of Sprint planning. Whatever the specific reason or root cause we’ve had a 27% Scope change and that is not good under almost any circumstance. We surely will have to deal with “the why” when we conduct our Retrospective. You may have also noticed that the metric clearly shows only 54% of the time has elapsed since the Sprint started so how can we only have 4 days left. Yet another terrific question! Well that is because we used up 7.56 days of time and now we only have 6.44 days left, right? Wrong! We started out with 14 days of 24 hours each. We started with 336 hours of time in the Sprint and have used 54% or 181.44 hours of it. That leaves us 154.56 hours or 6.44 days. But wait, it shows 4 days not 6 days so it is still incorrect. Well, there is a Saturday and Sunday involved that are non-work days so 48 hours are subtracted and that leaves us 4.44 days (154.56 – 48 = 106.56 and we divide that by 24).
Sprint Burndown Gadget
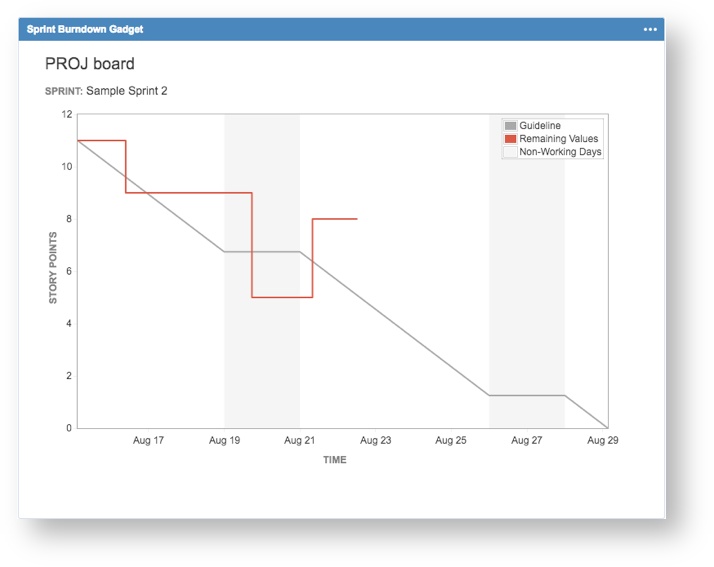
The Sprint Burndown Gadget provides an excellent visual indication of how your Scrum Team is progressing toward achieving results in the current Sprint. This Gadget shows the start of the current Sprint on the upper left-hand side and the end of the current Sprint on the far right-hand bottom of the chart. There is a resounding caveat here with this metric in that the only way this chart will be accurate is the estimation of each Jira Issue at the very beginning of the Sprint is done. As mentioned in my article, “Reporting in the Real World”, you must have good data to get good reporting. The estimation of each Story or Bug included in the Sprint is a must, otherwise the Sprint Burndown Chart will not be correct.
In our example shown, this provides very useful information. The Guideline shown as a grey line from the upper left to the lower right-hand side.
Data Source: Jira Issues and Bugs
Measure Boundary: Current Sprint
Measures: Story Points (effort) from the Original Estimate completed over Time
The non-working days are shown as darker grey vertical columns (i.e., normally weekends). The red line shows that we were doing not too badly in that we started with 11 Story Points and had made it to 5 remaining on the 21st of August but we had an additional Story or Stories that added another 3 Story Points to the Scope of the current Sprint (Potential Red Flag). Adding Scope to a Sprint underway isn’t a problem if it will fit within your Scrum Team’s Velocity. If it goes beyond the Scrum Team’s Velocity then you have a problem. As you can see this metric is of extreme value in that we can see how we are progressing toward results and that the Scrum Master may have a problem to resolve with the added Scope change. This Gadget provides us a sort of early-warning-system to ensure we have time to react and track our history toward delivering value.
“A point I often emphasize is the value of Burndown and Burn Up Charts as predictive tools. Knowing what you’ve done has limited value. Insight about the future is more valuable during execution, because the future is the only thing we can influence. Burndown and Burn Up Charts are useful (for Sprints and Release cycles, respectively) because they enable us to manage and modify scope in ways that allow us to achieve business goals on target dates.” – Thompson, Kevin (2017, Sept. 6) Blog Post
This metric should provide sufficient notice that things are heading the wrong direction and a course correction is required early enough that adjustments can be put in place to ensure successful results.
HOW TO READ THIS METRIC: What looks perhaps like a blue line from top left to bottom right is a grey line that is the “Guild Line” illustrating the nominal rate at which Story Points should be worked off as the Sprint progresses. The grey columns are the Saturday and Sundays involved within the “time box.” We seemed to have been doing a fairly good job of staying on track to complete all of the Story Points when low and behold, someone added another 3 Story Points to this Sprint. Adding Story Points to any Sprint can be problematic if you’ve not done a very good job of re-planning the effort, which is normally the case. Who on the Scrum Team of 5 to 7 has bandwidth top pick up the extra points? Where are we going to fit in the extra time for testing, for updating end user’s documentation if there is any, and on and on that question set goes. It would be far better to put that extra 3 Story Points in another subsequent Sprint where there is capacity. Of course, criticality, complexity, need, and a host of factors all are part of that decision as to where best to put these 3 extra points. Whatever the reason, the extra 3 points may mean we work longer hours during the week or put some time in over one of the weekends.
Team’s Workload
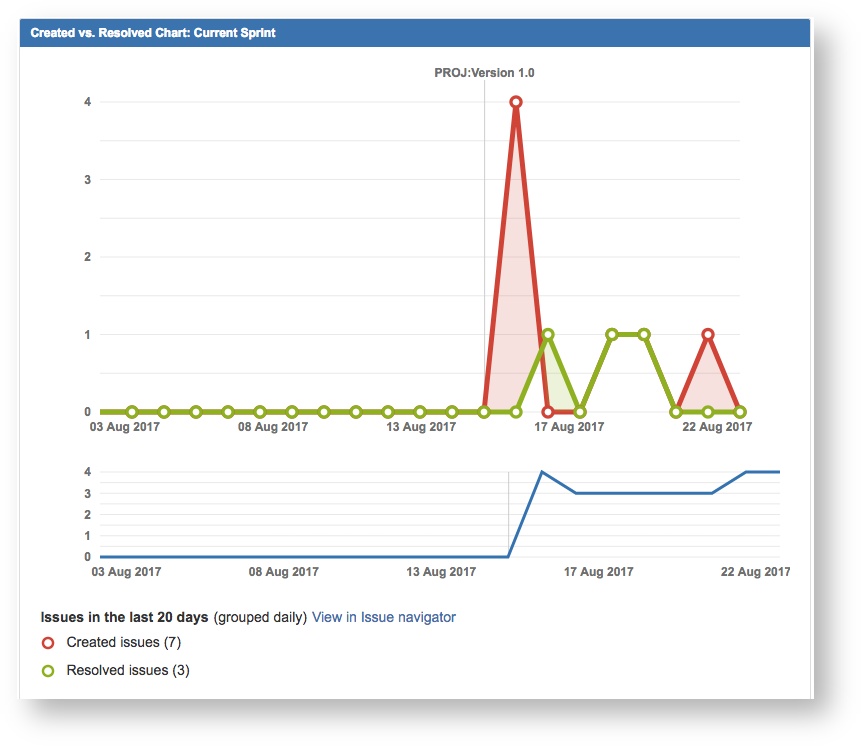
The Created vs. Resolved Gadget provides another excellent visual indication of how your Team is progressing toward achieving results in the current Sprint. This Gadget, properly configured, visually reports how many Issues (i.e., Stories and/or Bugs) that have been completed (i.e., Done) as opposed to those that have been created. Each day when you start this metric provides you with a visual indication of how things are going for the current Sprint. This Gadget provides some key indicators for keeping track of the history (trend line in blue) showing are you opening more Stories and Bugs than closing shown as an upward trend or resolving more than are being opened shown as a downward moving line. Obviously, downward trend is far better than an upward one. The green line with the small circles shows Issues Resolved (i.e., marked Done). The red line shows Issues created and any Stories or Bugs that get added to the Sprint after the Spring starts (i.e., additional scope). The rule of thumb here is to not exceed the Scrum Team’s total velocity measure for a given Sprint. Doing so adds significant risk to the Sprint and should kick off a need to resolve with the Product Owner.
Data Source: Jira Issues and Bugs
Measure Boundary: Current Sprint
Measures: Number of Issues Created or Resolved over Time
So, when looking at this metric one can easily and quickly determine if your team killing it, your team is keeping with the pace, or your team is simply being buried without remedy. As with the Sprint Burndown Gadget, this metric should also provide sufficient notice that things are heading the wrong direction and a course correction is required.
HOW TO READ THIS METRIC: We are being shown that 7 more issues have been created as opposed to the 3, which have been resolved. This metric is also capable of showing this is a cumulative format as well, which is not the case here. So, we can mouse over the bubbles on this metric and actually see which Issues were created. In this case all 7 were Sub-Tasks to Stories. Sub-Tasks are children of a Story, Spike, Bug, or Task and you cannot (by JIRA design) have a Sub-Task that is a child of another Sub-Task. So, while this metric may present a negative impression we can do some investigating and discover why there is suddenly a spike in the number of Issues created for this Sprint. The blue line under the red and green lines shows the trend and we are trending up meaning we’ve more Issues created than closed. A wonderful trend metric showing exactly what we need to know and also provides the ability to find the why.
Who is carrying the workload?
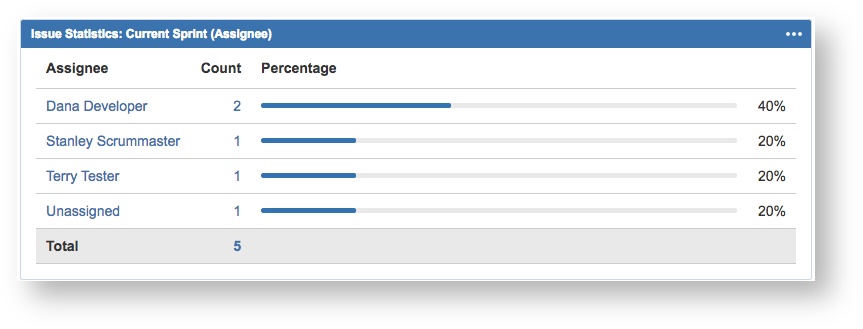
This metric is implemented using Jira’s Issue Statistics Gadget. There is an underlying Jira Query Language (JQL) filter (shown below) that is specifically setup to show just those Issues in the Sprint from one specific Jira Project called (PROJ). When properly configured this Gadget provides a very good visual indication of who on the Team is carrying the workload.
Data Source: Jira Issues and Bugs
Measure Boundary: Current Sprint
Measures: Number of Issues & Assignee
JQL Filter | sprint in openSprints() AND project in (PROJ)
So, for the Sprint what happens if:
- Any one Team members gets pulled off the Sprint and gets put on another effort?
- Any one of the Team members has to take leave of absence?
- Any one of the Team members calls in sick?
- What if any one of the Team Members is too overloaded and runs into blockers?
Add to these 4 reasons any one of a host of other reasons Scrum Team members are suddenly not available to work the Sprint. Besides all of that, you really want to know who is carrying the larger or largest portion of the workload. This metric will tell you which members are most important and help you keep your risk mitigation plan current. It is a very old adage but still true even today, “…if you fail to plan you are planning to fail!” Knowing who is doing most of the work is vital to keeping track of the Scrum Teams overall progress and should help in demining how much of that work can be redistributed amongst the other Team members.
HOW TO READ THIS METRIC: A quick glance at this metric makes it clear that Dana is carrying more of the workload than others. Now, granted that this is showing only 3 of the members of our Scrum Team so right off the starting line we have a problem. Where is every one else and why do we only have one Issue that isn’t assigned? The thing to remember about this metric is we are just counting Issues nor Story Points so while Dana may have 2 Issues assigned to her that DOES NOT mean that she has most of the work or Story Points. Dana just has 40% of the Issues assigned to her. Another aspect to this metric is that it is showing Story level issues and not Sub-Tasks as Sub-Tasks are included in the Sprint the parent resides in. Thus, if I move a Story to another Sprint all of the Sub-Tasks for that Story move with it. This metric is most valuable in keeping track of who is assigned the most Issues in the Sprint and aid in risk management / contingency planning if you lose a Team Member, they go on vacation, they are out sick, etc. It also makes it rather easy to reassign their work to another person if needed as you don’t have to go searching for what Issues are assigned them.
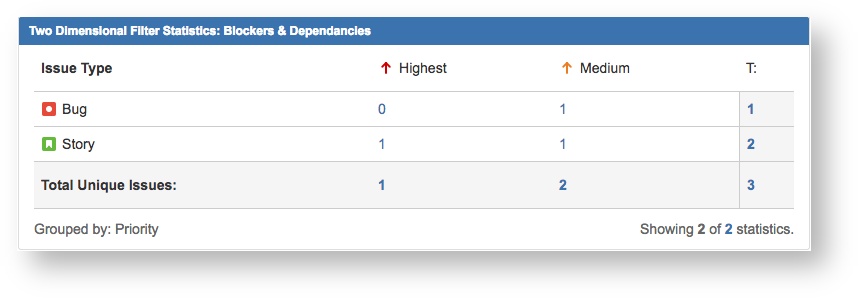
Blockers and Dependencies
This metric is also implemented using Jira’s Two Dimensional Gadget. Similary to the last metric, this metric also has an underlying Jira Query Language (JQL) filter (shown below) that is specifically setup to show just those Issues in the Sprint from the same Jira Project. There are some limitations with Jira without the addition of any Add-Ons, like Cprime’s awesome Power Scripts, that somewhat hinder our ability to use JQL to search for link types (i.e., blocks/is blocked by, depends on/is dependent on, etc.). To offset this JIRA out-of-the-box limitation I created a Custom Field called “Display on Impediment Board” with only two values, yes and no. If set to “YES” then the filter picks up the Issue and displays its information on the Blockers & Dependencies Gadget.
Data Source: Jira Stories and Bugs
Measure Boundary: Current Sprint
Measures: Issue Type & Priority
JQL Filter
sprint in openSprints() AND “Display on Impediment Board” = YES AND project in (PROJ)
The value of this metric is that we can quickly and easily determine what impediments the Team is up against. The Scrum Master in paticular so be looking at this metric at least a few times a day to help remove any and all impediments as soon as possible. The overall goal is to not have any impediments show up in the Sprint. Realistically, that would be a very rare occurance.
HOW TO READ THIS METRIC: This metric provides value in a few ways. First, we have a clear indication of what problems are present that are either a blocker (keeps us from accomplishing work) or dependancies (things that we need to make our software run/work). That is incredibly valuable information when running any software development effort. Second, it is part of our risk management early warning system. This lets us know in clear fashion we have problems that are likely to prevent our success unless they are resolved fast enough to not hinder our quick and easy development. Third, we also understand which of these blockers and/or dependancies are highest priority then medium and so on. The highest priority the Scrum Master on the Scrum Team needs to be working on first before the next level down priority.
Issues Assigned to Me
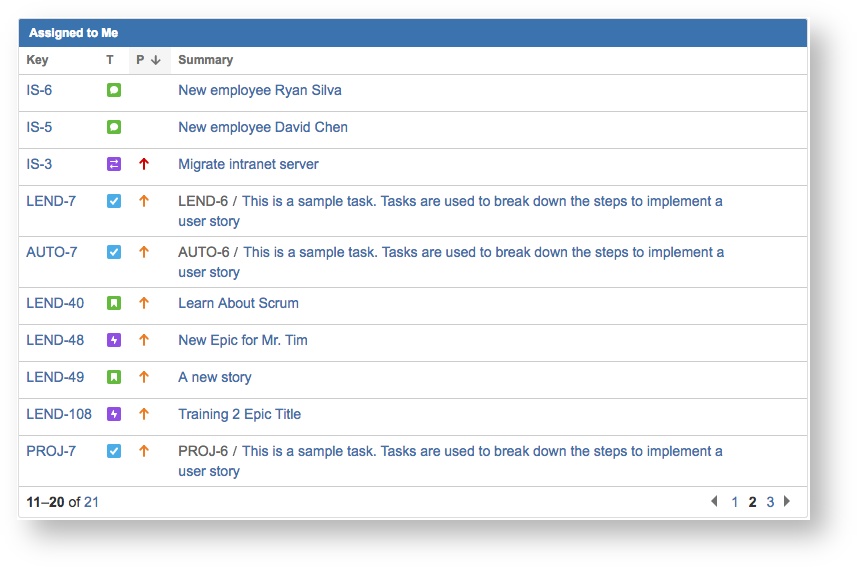
This metric is also implemented using Jira’s Assigned to Me Gadget. Knowing what your individual workload is like and what you’ve been tasked to do is very important. This metrics is intended for each Team Member as it displays only those JIRA Issues that are assigned to them.
Data Source: Jira Stories and Bugs
Measure Boundary: Current Sprint
Measures: Issue Key, Issue Type, Priority, and Summary
There is a wide variety on how this is used with a Sprint. There are Scrum Teams that like to farm out the work (i.e., assign Issues) during Sprint Planning. Others, like to just create the Issues and then assign them straight away. This is the one report that each Team Member needs to look at daily.
HOW TO READ THIS METRIC: This is a metric that each member of a Scrum Team should be using to see what their workload/tasking is currently. This metric shows all Issues assigned to them NOT JUST those in the Sprint, if that situation exists. This is one metric that should be looked at twice a day, at a minimum. As a Team Member, I can see what is on-my-plate to get done.
SIDE NOTE: The thing that must be understood is that if the resolution field (built in to Jira) IS NOT SET to a value when an Issue is marked Done then it will remain present on this metric. Too oft I have seen where Jira is not setup to place a value into the Resolution field and many of the gadgets, depending on configuration, will continue to display completed issues.
Agile Reporting In JIRA
Jira Software Reports that are available within each JIRA Scrum Board Project
Scrum and Kanban reporting
Burn ups, burn downs, velocity, sprint reports, and more
Jira Dashboards that are available to create customized views
Summary of valuable key data
Accommodates Agile focused views
Jira Add-ons
Advanced add-ons to provide reporting overlays
Multiple ways to interact with the data
Conclusion
Real-time reporting is all about how your work is going. It is absolutely crucial in making good decisions. You need to know the progress on Stories, Spikes, Tasks, Bugs and Sub-Tasks at the Team level, Sprint/Release progress, trends showing up in the data regarding Sprint velocity, cycle-time, what is working and what is not working. Similarly, progress on Epics for the Program and Portfolio levels. Good reporting makes for an ability to ask better questions and that makes for solid sound practical and informed decisions.
Need help with Jira Reporting or Agile Metrics as a whole?
