SAFe 6.0 Deep Dive – Flow Metrics (Part 1 of 2)
If you are applying SAFe® (Scaled Agile Framework®) or are considering doing so, you are most likely aware of at least some of the key updates to the V6.0 release. One of the most critical additions to this update is the concept of “flow”.
What is Flow in SAFe 6.0?
Scaled Agile’s official definition of Flow is as follows:
“Flow is characterized by a smooth transition of work through the entire value stream with a minimum of handoffs, delays, and rework. In SAFe, we consider flow to be present when teams, trains, and the portfolio can quickly, continuously, and efficiently deliver quality products and services from trigger to value.” (© Scaled Agile, Inc.)
SAFe 6.0 provides a detailed account of the various flow concepts and metrics that you should consider when implementing SAFe. While this information is very thorough, many practitioners I work with expressed an interest in more specific examples related to how to deploy these metrics. Hence, I thought it might be worthwhile to illustrate the use of these metrics through a simple, everyday example that most of us should be able to relate to so we can gain a better understanding overall.
An example from manufacturing
Because of the level of detail that will be covered, it made sense to split this into a two-part series to ensure we provide adequate coverage of all six of the flow metrics that are recommended by SAFe 6.0. Let’s first go over the details of a fictitious project which we will use to clarify the flow concepts.
When I facilitate training sessions for my clients, I often think about a common example that is not specific to any industry or technology so that I can try to reach as many of my students as possible and help them connect to their own contexts. Although there may not seem to be a clear alignment to Agile principles and practices, I often use manufacturing concepts as a backdrop to explain Lean-Agile concepts. For this exploration of flow metrics, we will use the concepts of automobile manufacturing to clarify the ideas.
The Toyota Manufacturing / Toyota Production System (TPS) is considered the foundation for today’s Lean manufacturing processes. Hence, we will connect to SAFe’s flow metrics by inspecting how these may map to building hardware and software solutions within an Agile Release Train.
The 6 Flow Metrics
Let’s first look at the 6 Flow Metrics that SAFe recommends.
| Metric | Definition |
| Flow Distribution | Proportion of work items by type |
| Flow Velocity | Number of completed work items over a fixed period |
| Flow Time | Time elapsed from start to finish for a work item |
| Flow Load | Number of work items currently in progress |
| Flow Efficiency | Ratio of the time spent in value-added work divided by total time |
| Flow Predictability | Level of consistency with which teams/trains/portfolios meet their objectives |
Flow Distribution
The key concept behind monitoring the distribution of different types of work is to understand how long-term and short-term objectives are being supported. For example, work may include infrastructure/enablers, sustainment/maintenance, and new capabilities/features. If one type of work is dominating the overall distribution, the risk to the overall health of the product life cycle may be elevated.
Using an automobile manufacturing assembly as an example, the assembly line will typically contain a variety of car models that are in distinct stages of the overall assembly process.
Within this context, we may want to see how much of the resources (human capital and technological assets) are deployed for the development of the chassis, painting, electronics, etc.
From another perspective, at the portfolio level, it may be worthwhile to examine how funding is allocated to research and development for future car models or manufacturing of current-year models.
By looking at the flow distribution of how work is executed for various types of work, we can assess trends (i.e. peaks, valleys, outliers, etc.) which will enable the team to make informed decisions on potential shifts in the allocation.
Flow Velocity
Using the automobile manufacturing example, flow velocity is easy to explain—it is simply the number of vehicles produced within a time horizon. For example, 1,000 cars per day, or something to that effect. In your world, depending on what type of product or service you are building, this metric may not be as simple to measure, especially if you are not shipping a physical product. However, if you are producing a service, you will probably depend on some type of technology to support that service, which I would suspect to be a digitally enabled system, in which case you can measure the number of features and/or functions that your team is deploying within a specified timeframe. That can also qualify as flow velocity.
One key thing to keep in mind is that the purpose of collecting this data is to evaluate the performance of the team in terms of productivity and efficiency. Trends will be valuable to determine whether the overall performance is improving or degrading over time.
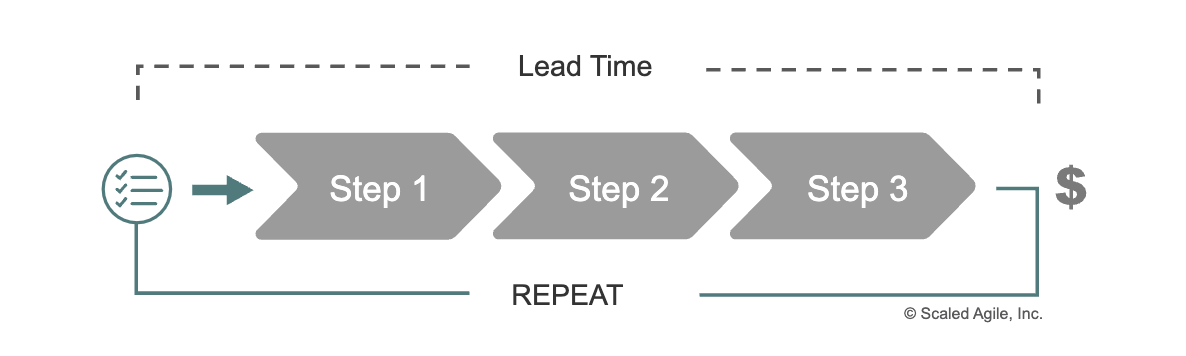
Flow Time
In delivering products or services to the customer, nothing is more noticeable than speed; customers can often compromise on the complexity and sophistication of a solution, but they are almost always eager to receive something as quickly as possible, no matter how incomplete it might be.
We need to keep in mind that this does not mean we can put low-quality goods into the hands of the customers and expect them to be happy. Faster delivery means we will provide a high-quality product, but possibly without all the special features that may be perceived as “nice-to-have”.
Flow time is one method of measuring how much time your team needs to put that capability into your customers’ hands. It is a trending metric that allows you to determine if your team is improving its efficiency (reduction in time), stabilizing (by a plateauing effect) or even degrading (taking more time to deliver value).
Within the context of automobiles, flow time can be measured as the number of hours/minutes required to build a complete, functioning car that is ready to be driven.
In Part 2 of this Deep Dive, we will cover the remaining three Flow Metrics:
- Flow Load
- Flow Efficiency
- Flow Predictability
In the meantime, if you need any help with this or other SAFe concepts, consider our catalog of SAFe-related learning courses and certification programs.
Learn more and get SAFe certified!
Be SAFe